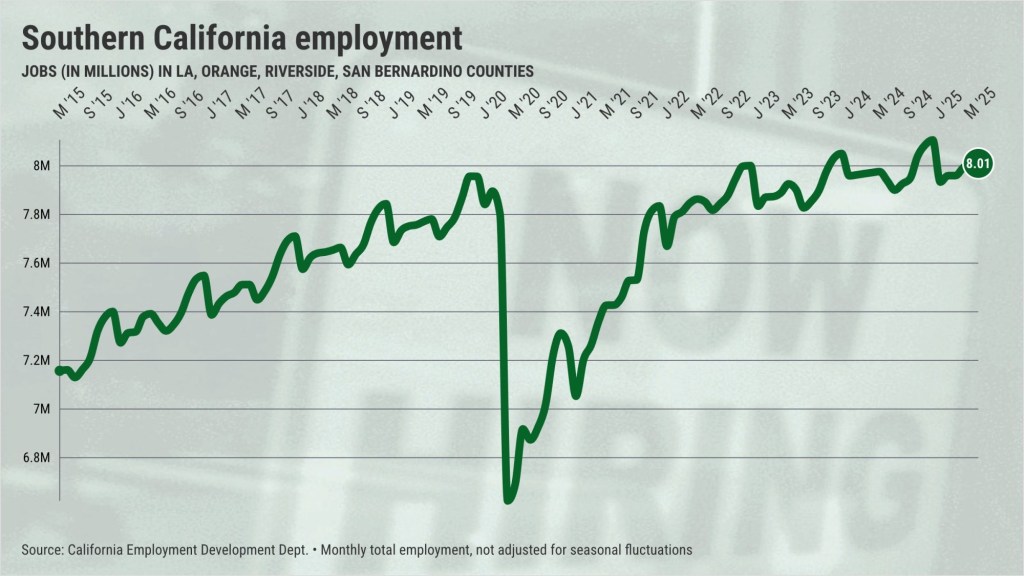
Southern California bosses collectively cut 1,200 jobs in June compared with May, but some economic hope was found within these monthly employment swings.
June is typically not a strong month for the local job market, as seasonal forces combine, keeping employment counts historically flat. And in 2025, the local economy is adapting to a new White House administration with policies that run counter to the region’s globally oriented business landscape.
My trusty spreadsheet, filled with newly released state job figures, found 8.01 million at work in Los Angeles, Orange, Riverside, and San Bernardino counties in June. The modest one-month dip in local job counts – not adjusted for seasonal swings – compares with the 400 positions that were typically added across the region since 2010.
Note that local jobs grew by 71,300 in the past 12 months.
Industry swings
Of 15 major Southern California job niches, 10 added staff in June, compared with the historical average of 11.
Consider the one-month job changes in these key business sectors, ranked by one-month change, compared with their median trends for June, dating back to the Great Recession’s end. Now, we are only discussing one month, yet some unexpected hiring patterns have been identified…
Construction: 365,400 workers – up 6,300 in June vs. 3,300 historic hires. Are slightly lower mortgage rates helping real estate development? Or is it wildfire reconstruction?
Hotels/entertainment/recreation: 284,400 workers – up 5,000 in June vs. 2,100 historic hires. Jobs grew by 9,300 in a year. The loss of international travelers does not appear to be a factor. Yet.
Retailing: 719,800 workers – up 2,100 in June, compared with 1,000 historic hires. Jobs grew by 3,400 in a year. Merchants appear more buoyant than reports of dismal consumer sentiment.
Social assistance: 541,000 workers – up 2,000 in June vs. 500 historic hires. Jobs grew by 34,300 in a year. This long-running upswing is at risk from cuts in federal spending.
Full-service eateries/food service: 335,000 workers – up 1,700 in June vs. 100 historic cuts. Jobs dipped 700 in a year. It’s a surprising strength considering numerous challenges.
Fast-food restaurants: 345,900 workers – up 1,700 in June, equal to its historic pace. Jobs dipped 5,500 in a year. Has the industry adapted to a higher minimum wage?
Manufacturing: 543,200 workers – up 500 in June vs. 1,800 historic hires. Jobs dipped by 20,400 in a year. Long-suffering industry. Will tariffs stem the losses by bringing factory work back to the U.S.?
Financial: 346,600 workers – up 300 in June vs. 600 historic hires. Jobs dipped by 8,400 in a year. High interest rates hurt.
Information: 223,000 workers – up 200 in June vs. -2,400 historic cuts. Jobs grew by 3,400 in a year. Have tech and Hollywood hit bottom?
Personal services: 266,200 workers – up 200 in June vs. 600 historic hires. Jobs grew by 1,400 in a year. Is immigration enforcement trimming staff?
Government: 1,059,900 workers – down 300 in June vs. -2,400 historic cuts. Jobs grew by 19,600 in a year. How long can growth continue as municipal budgets get tighter?
Healthcare: 863,300 workers – down 2,000 in June vs. 300 historic hires. Jobs grew by 41,200 in a year. Tighter insurance reimbursements may be a factor.
Logistics-utilities: 787,900 workers – down 2,700 in June vs. 1,500 historic hires. Jobs dipped 100 in a year. International trade tensions may be slowing distribution work.
Professional-business services: 1,112,300 workers – down 9,700 in June vs. 2,500 historic hires. Jobs dipped 6,100 in a year. Is the return-to-office push hurting this employment niche?
Private education: 210,800 workers – down 9,700 in June vs. 12,600 historic cuts. Jobs grew by 10,100 in a year. Non-public schools are popular.
Regional differences
Here’s how the job market performed in the region’s key metropolitan areas in June …
Los Angeles County: 4.61 million workers, after dropping 6,500 in a month, vs. historically 1,700 cuts. Grew 41,700 in a year.
Orange County: 1.70 million workers, after adding 2,200 in a month. Hiring since 2010 averaged 2,300 additions in the month. Grew 11,900 in a year.
Inland Empire: 1.71 million workers, after dropping 100 in a month, vs. an average of 1,000 cuts in the month. Grew 17,700 in a year.
Jonathan Lansner is the business columnist for the Southern California News Group. He can be reached at jlansner@scng.com


