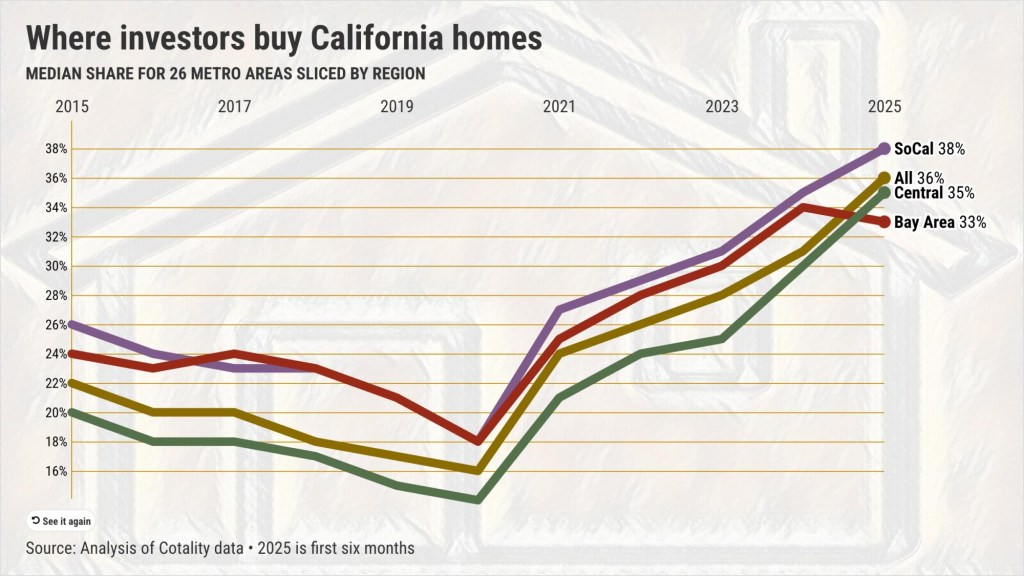
Investors, just like house hunters, like a bargain. And in California, that means looking inland.
My trusty spreadsheet reviewed data from Cotality – previously known as CoreLogic – tracking the share of single-family home purchases made by people not occupying the property. My focus was on the average pace of the past 18 months – last year and the first six months of 2025 – and how those investment patterns compared to the previous nine years.
What stands out: Seven of California’s 10 most significant increases in investor share of homebuying were nowhere near the Pacific.
Yes, the top two markets for investment purchases are large, expensive metro areas. They’re also the places where a typical house hunter is financially unable to buy a home. So, wealthier investors have a decided edge.
San Jose was the investor’s overall favorite metro in California, according to this metric. In the last 18 months, investors averaged 47% of all single-family home purchases in San Jose.
That share compared with 27% in 2015-23 – a 20-percentage-point jump. So San Jose also witnessed the second-largest increase across the 26 markets tracked.
Investors’ No. 2 metro was the Los Angeles/Orange County combo, where investors claimed 43% of purchases in the last 18 months vs. 29% over the previous nine years – the No. 7 statewide jump.
Yet numerous investor hotspots are some of California’s relatively affordable locales – if anything in the state is really “affordable” housing.
The third-most popular spot for investors was El Centro, with a 40% share in the last 18 months compared to 19% over the previous nine years. That 21-point surge was the state’s largest.
Salinas was No. 4 at 39% of purchases last 18 months vs. 26% in 2015-23, the 11th-largest increase.
And No. 5 was San Diego, another big and costly market. Its 37% investor share over the last 18 months was up from 25% during the previous nine years – the No. 15 increase.
Bargain hunting
Consider the location of other metros, not previously mentioned, where investor activity grew the fastest. Simply put: no ocean breezes.
No. 3 Hanford: 34% last 18 months vs. 16% in 2015-23.
No. 4 Fresno: 36% last 18 months vs. 20% over the previous nine years.
No. 5 Visalia: 35% last 18 months vs. 19% in 2015-23.
No. 6 Merced: 36% last 18 months vs. 21% over the previous nine years.
No. 8 Modesto: 34% last 18 months vs. 19% in 2015-23.
No. 9 Stockton: 34% last 18 months vs. 20% over the previous nine years.
No. 10 Bakersfield: 32% last 18 months vs. 18% in 2015-23.
Why inland? Ponder affordability indexes from the California Association of Realtors.
In 20 counties in Southern California, the Bay Area and the Central Coast, a median of 17% of households could afford to buy this spring. That’s down from 21% four years earlier.
In 33 California counties outside those largely coastal markets, median affordability ran 29% – but that’s down from 39% in 2021.
Big picture
Investment purchases are on the rise across the state.
Overall, 33% of California house purchases were made by investors during the past 18 months vs. 21% in 2015-23.
Consider what was revealed when the 26 metros were divided into three geographic hubs.
The 12 inland metros had a median 32% investor share over the last 18 months vs. 19% during the previous nine years – the biggest boost among the three hubs.
Investors accounted for 36% of homebuying in seven Southern California markets over the last 18 months, compared with 25% in 2015-23.
And the seven Bay Area metros? A 34% share over 18 months was up from 24% over the previous nine years.
Jonathan Lansner is the business columnist for the Southern California News Group. He can be reached at jlansner@scng.com
Originally Published:


