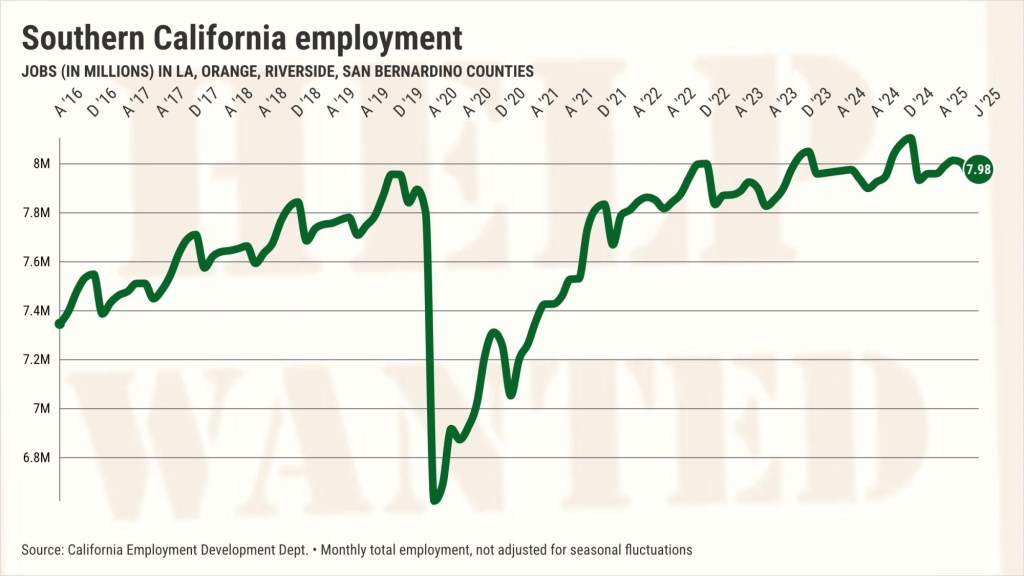
Here’s more evidence of a cooling job market: Southern California’s bosses added 51,400 workers in the year ending in August, roughly half the typical pace in the post-Great Recession era.
My trusty spreadsheet, filled with newly released state job figures – not adjusted for seasonal swings, found 7.98 million at work in Los Angeles, Orange, Riverside and San Bernardino counties in August. Local job growth is down from the 71,600 positions that were created in the previous 12 months and the average 106,000-a-year hiring pace since 2010.
The job additions lowered the four-county unemployment rate to 5.9% in August from 6.1% in the previous month. It was also 6.1% a year earlier. By the way, the median monthly jobless rate for the region since 2010 is 5.8%.
There were 537,300 counted as officially out of work, down 7,900 in a month and down 12,000 in a year. The jobless count is 6% above the 507,100 median since 2010.
A slower hiring pace, both locally and nationally, was on the minds of Federal Reserve policymakers when they tried to boost the economy with 2025’s first cut in the interest rates that the central bank controls on Wednesday.
Regional differences
Here’s how the job market performed in the region’s key metropolitan areas in August …
Los Angeles County: 4.59 million workers after adding 31,600 in 12 months vs. 47,000 annual pace since 2010. Unemployment? 6.3% vs. 6.4% a month earlier, 6.0% a year ago and 6.2% median since 2010.
Orange County: 1.69 million workers after adding 5,200 in 12 months vs. 21,600 annual pace since 2010. Unemployment? 4.6% vs. 4.8% a month earlier, 4.0% a year ago and 4.3% median since 2010.
Inland Empire: 1.70 million workers after adding 14,600 in 12 months vs. 37,400 annual pace since 2010. Unemployment? 6.1% vs. 6.4% a month earlier, 5.3% a year ago and 6.2% median since 2010.
Revisions ahead?
Southern California job counts also will see annual revisions, a topic that created a political storm this summer.
However, the direction of those local revisions – slated for release in early 2026 – is not clear when compared with the sharp downward revision for U.S. jobs.
Consider the Southern California jobs picture painted by the latest federal quarterly employment figures that are derived from unemployment insurance records. These are crucial to government job analysts’ annual job-count revisions. Then see the difference with the previously released monthly jobs stats as of March 2025.
The region’s employers cut 12,400 workers in a year, according to the new quarterly records. That’s a smaller dip than the 15,800 decline from the previously reported monthly surveys.
As for the three big job markets, for the year ended in March:
Los Angeles County: New records show a 13,100 decline – smaller than the 22,600 dip from the survey.
Orange County: 3,700 decline from new records – smaller than the survey’s 5,000 dip.
Inland Empire: 4,400 gain from new records – smaller than the survey’s 11,800 increase.
Jonathan Lansner is the business columnist for the Southern California News Group. He can be reached at jlansner@scng.com
Originally Published:


