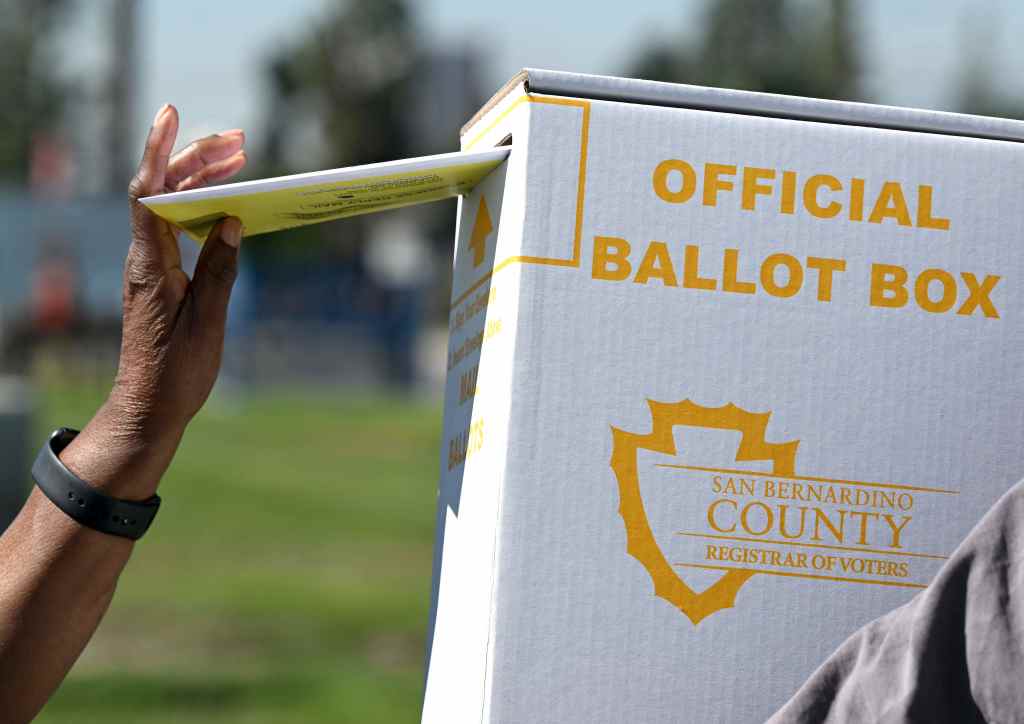
The Inland Empire remains a political Rorschach test ahead of the Nov. 4 special election that could redraw California’s congressional districts.
If you’re a Democrat, you might see a region with a solid, consistent plurality of registered Democratic voters — many of whom live in the largest Inland cities — who are more likely to vote yes on Proposition 50.
If you’re a Republican, you might be encouraged by a yearslong trend that’s narrowing, however slightly, the GOP’s voter registration shortfall. Also, President Donald Trump last year became the first Republican presidential candidate in 20 years to win Riverside and San Bernardino counties.
If it passes, Proposition 50 could give California Democrats a better chance of picking up five House of Representatives seats to offset GOP gerrymandering in Texas.
Proposition 50’s redrawn district maps could make it much harder for Rep. Ken Calvert, R-Corona, and San Diego County Republican Darrell Issa to win reelection. Calvert represents much of western Riverside County while Issa’s current district includes Murrieta and Temecula.
Here’s a look at Inland voter registration trends heading into the special election.
What’s the current picture?
Since 2016, there have been more registered Democrats than Republicans in Riverside and San Bernardino counties.
As of September, Democrats made up roughly 38% of voters in Riverside County and about 40% of San Bernardino voters, California Secretary of State data show. Republicans account for about 32% of Riverside County voters and 31% of San Bernardino County voters.
Between 21% and 22% of voters in Riverside and San Bernardino counties are not affiliated with any political party. Riverside County has more than 1.4 million registered voters. The number is 1.24 million in San Bernardino County.
What’s changed recently?
Not much, according to the secretary of state. Between February and September, the number of registered voters grew less than 2% in both counties.
That said, the GOP outpaced Democrats in adding new Inland voters. The number of registered Republicans grew 1.61% in Riverside County and 1.51% in San Bernardino County between February and September.
In contrast, the number of registered Democrats grew 1.02% in Riverside County and 0.81% in San Bernardino County. No-party-preference voter registration went up 1.48% and 2.71% in Riverside and San Bernardino counties, respectively.
“In the growing IE, both major parties are still gaining in numbers,” Marcia Godwin, a professor of public administration at the University of La Verne, said via email.
“Still, it seems like the Democrats have been losing some ground.”
Why are Republicans gaining more voters?
The numbers fit a trend going back to 2020 of the GOP recruiting more voters than Democrats across the Inland Empire. Republicans outpaced Democrats in more than 30 cities, including some of the region’s bluest.
The trend might be tied to ethnicity. Latinos, a voting bloc that swung toward Trump and Republicans in 2024, are a slight majority in Riverside and San Bernardino counties, and some of the GOP’s biggest Inland gains are in Latino-majority cities.
Also, Republicans are more likely to buy homes in newer Inland housing developments, Godwin said.
What does this mean for Prop. 50?
It’s hard to say, at least when it comes to the Inland Empire.
Democrats are more apt to vote for Proposition 50 than Republicans. Forty-five percent of California voters are Democrats, compared to 25% for the GOP.
Proposition 50 backers are counting on high levels of anti-Trump sentiment, especially in deep blue San Francisco and Los Angeles, to pass the ballot measure. In that context, the Inland Empire vote would likely only matter if the Proposition 50 vote is extremely close.
If that’s the case, Gov. Gavin Newsom and other Proposition 50 supporters would have reason to be nervous. Godwin has said the measure’s Inland fate hinges not only on voter turnout, but on which voters cast ballots.
“We used to be able to predict that independent voters in Republican areas leaned Republican and those in Democratic areas leaned Democratic,” she said.
“That isn’t necessarily the case anymore. We also have seen some ticket splitting within this group since 2020 with votes split based on personality or issues, not just party ID.”
BLUE AND RED IN THE IE
Riverside County
Democrats: 542,778 voters (38.1% of all voters)
Republicans: 462,321 (32.5%)
No Party Preference: 304,382 (21.4%)
San Bernardino County
Democrats: 479,990 (38.6%)
Republicans: 383,294 (30.8%)
No Party Preference: 271,612 (21.9%)


